
Picking the right neighbourhood feels like the hard part of expansion. In practice, it's often where the real work starts.
Once you have a shortlist, someone has to find units, book viewings, chase agents, compare rents, sort out heads of terms and keep the board informed. For most growing brands, all of that lives in a spreadsheet, an inbox and somebody's memory. Deals stall because a follow-up was missed. Good units get lost because nobody wrote down why they were rejected the first time.
We built deal tracking into Footprint because our customers kept leaving the app at exactly this point. Here's how it works, using a made-up example: a boutique pilates studio looking for its next site in south-west London.
Start from the map, not a blank row
Every deal in Footprint starts from something you've already found. That might be a neighbourhood from your results, a high street, or a pin dropped on a specific corner.
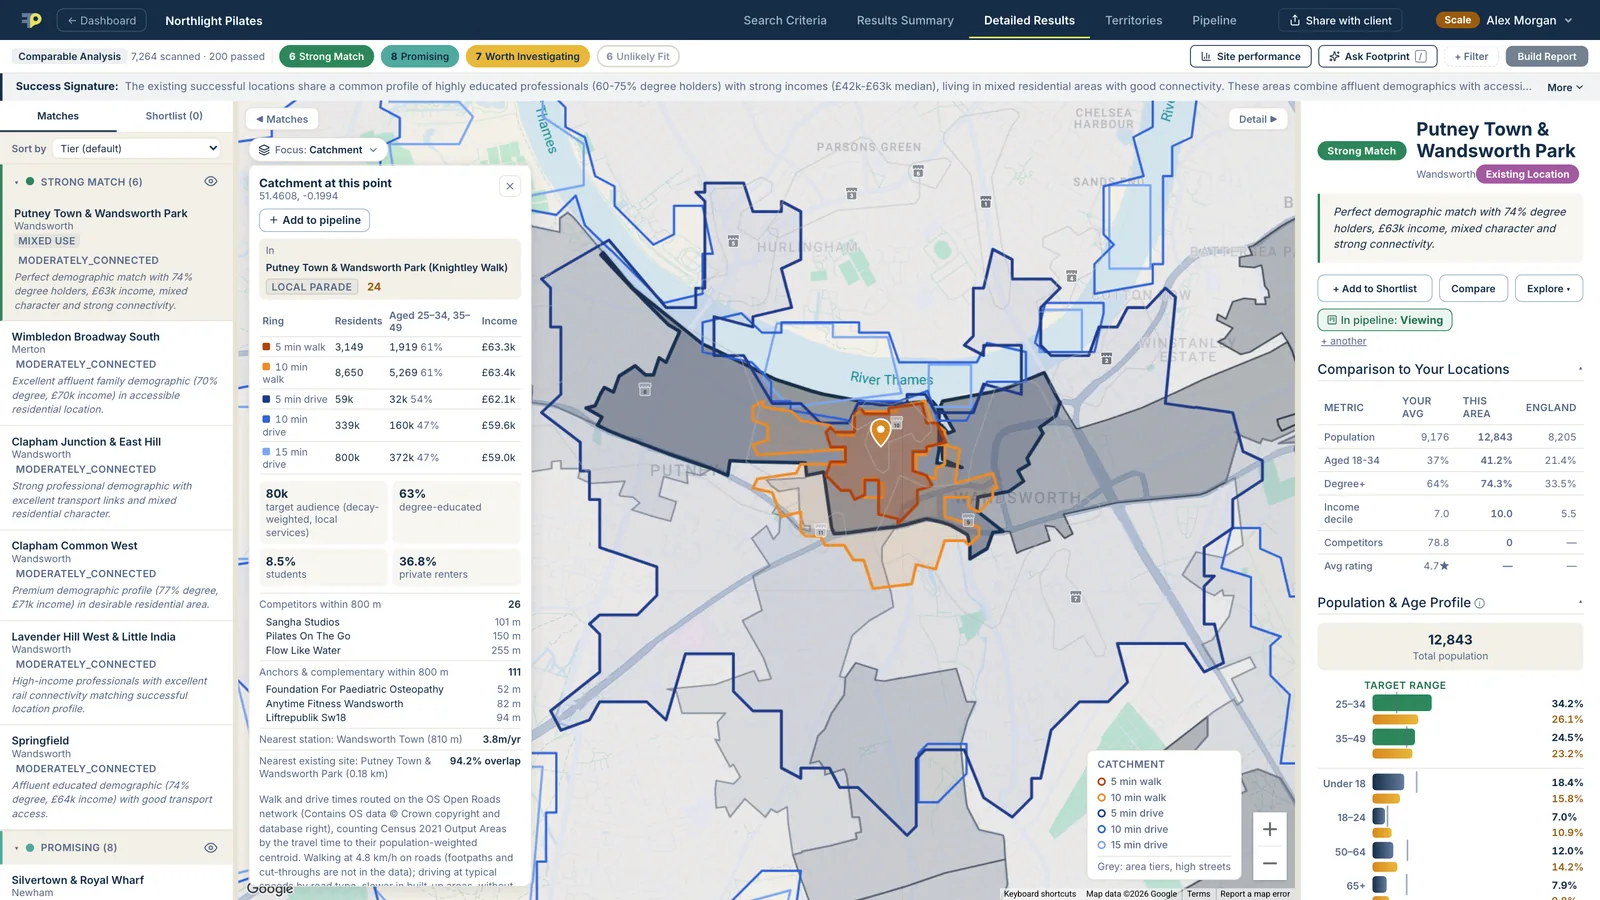
Dropping a pin shows who lives within a 5 and 10 minute walk, and a 5, 10 and 15 minute drive, along real roads rather than straight-line circles. If the spot looks promising, one click adds it to your pipeline. You're not retyping an address into a spreadsheet, and the deal keeps its link back to the data that made it worth a look.
One board for every unit
Deals sit on a board with a column for each stage of a UK commercial letting: shortlisted, viewing, offer made, heads of terms, lease signed, fit-out and open.
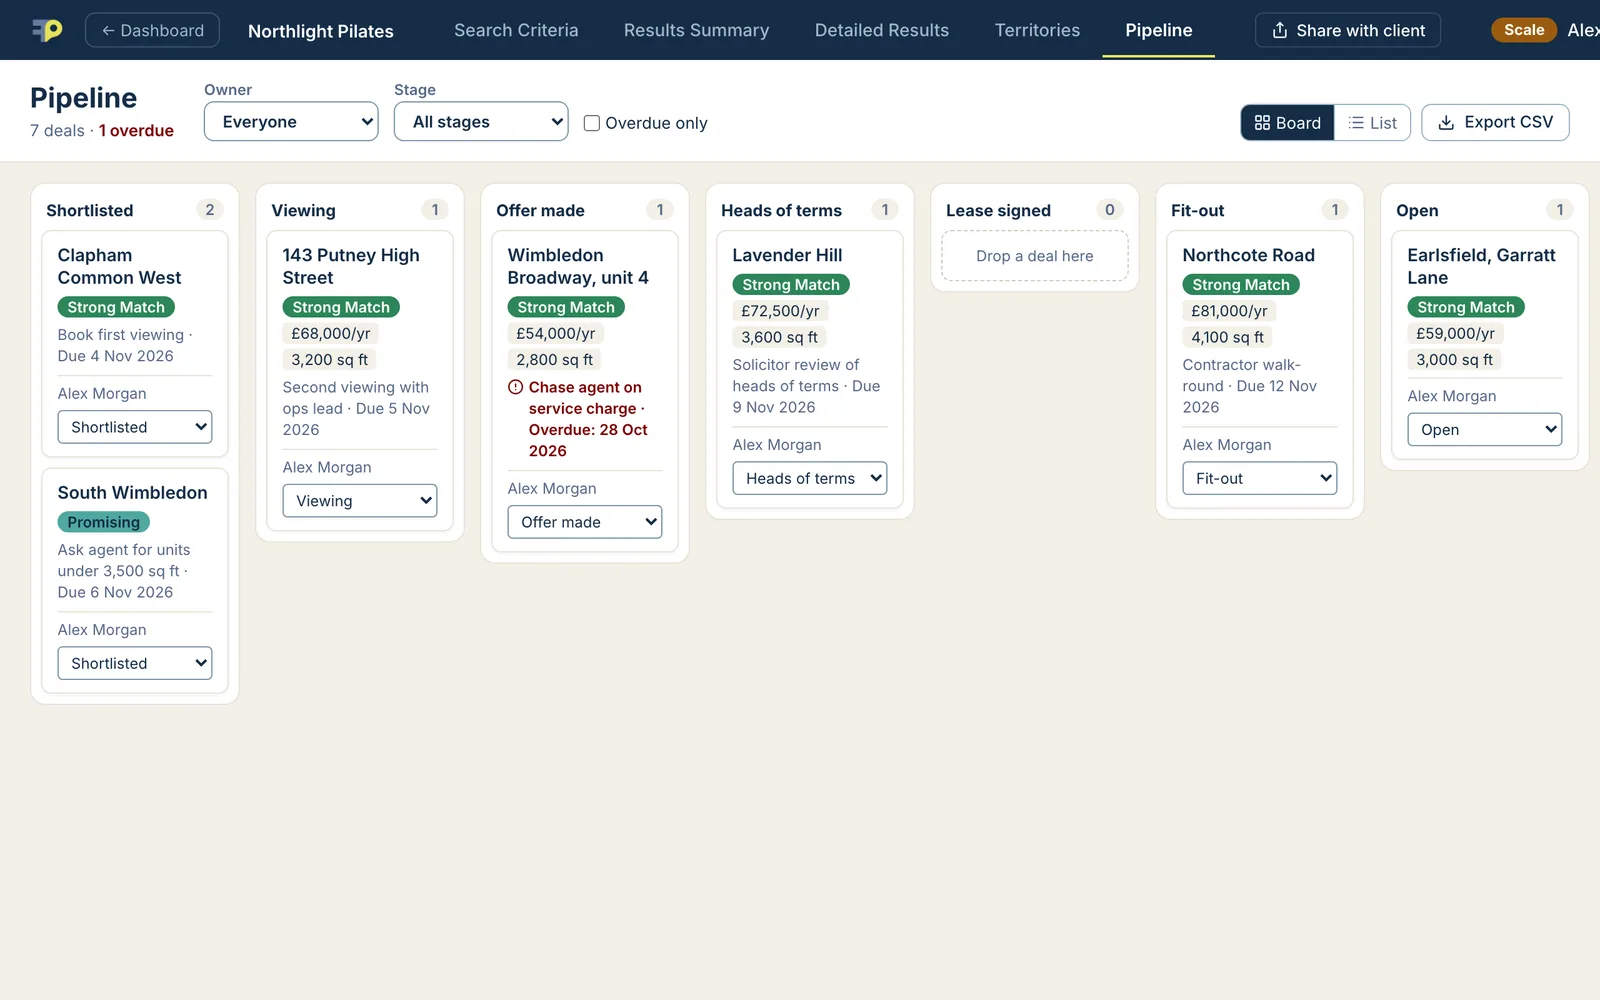
Each card shows the area's fit, the rent and size if you have them, who owns the deal and what happens next. Anything overdue turns red. You can drag a card to the next stage or use the dropdown on the card, and every move is recorded with who made it and when.
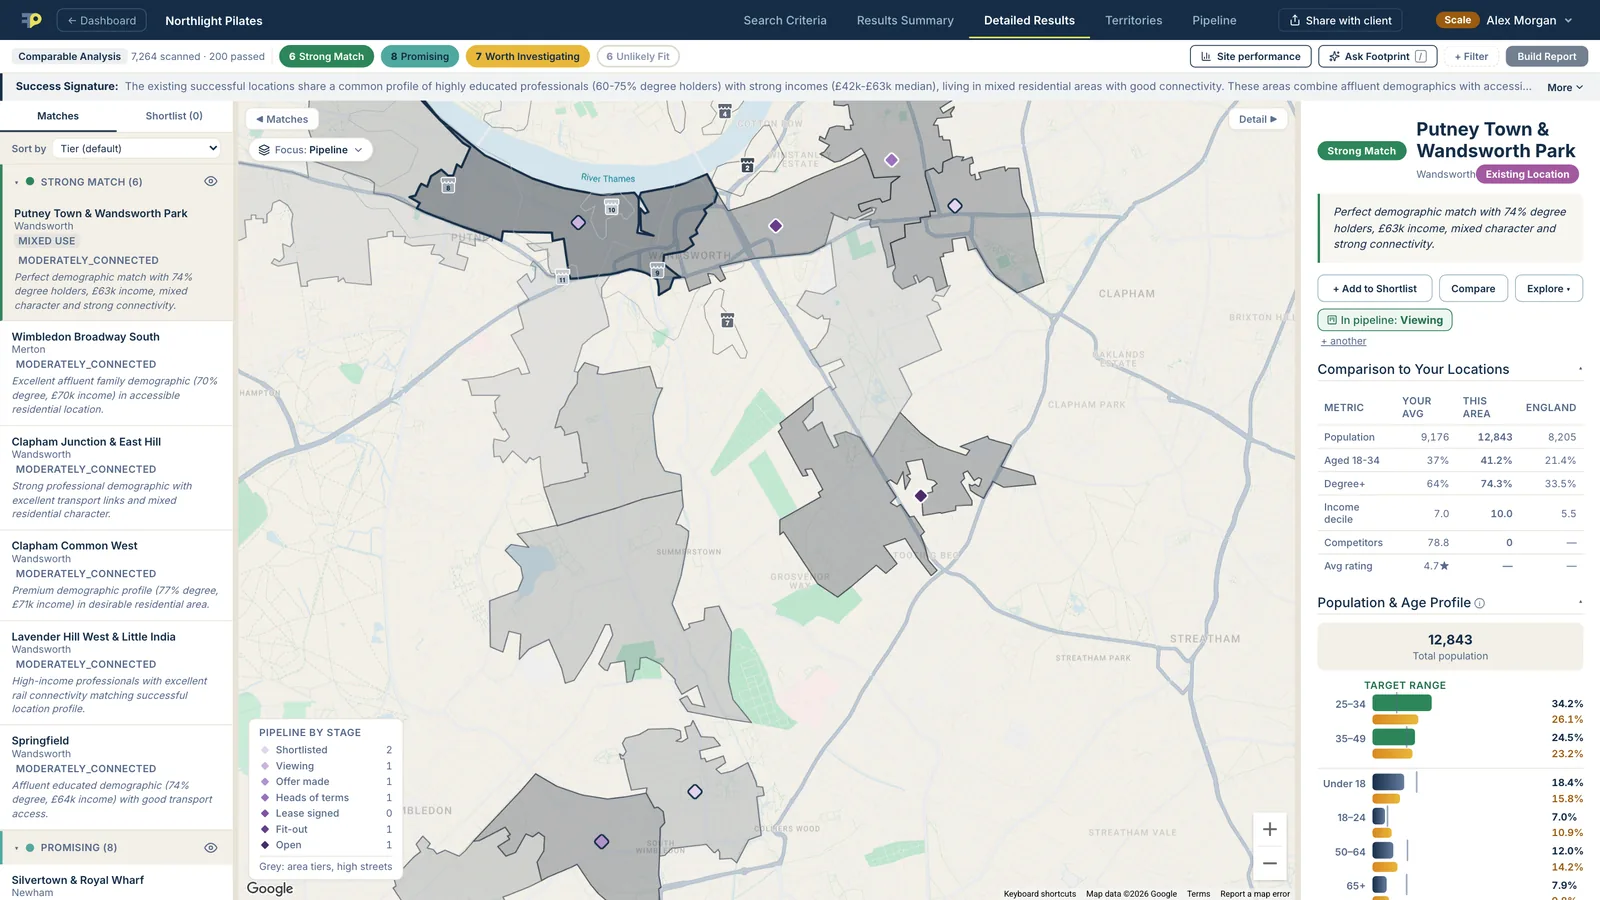
Switch the map to Pipeline and every live deal appears as a pin, shaded by stage, with your search results in grey behind it. It's an easy way to spot gaps in a territory, or two deals competing for the same catchment.
If a deal falls through, Footprint asks why. Rent too high, unit unsuitable, lost to another tenant, landlord withdrew. Six months later, when the same unit comes back on the market at a lower rent, you'll know exactly why you walked away.
Everything about a unit in one place
Open a deal and you get the details that usually end up scattered across emails: the address, listing link, rent, size, notes and the next action with a due date. There's a pre-filled Rightmove search for commercial units to let in the area, so you can check what else is available nearby without starting from scratch.
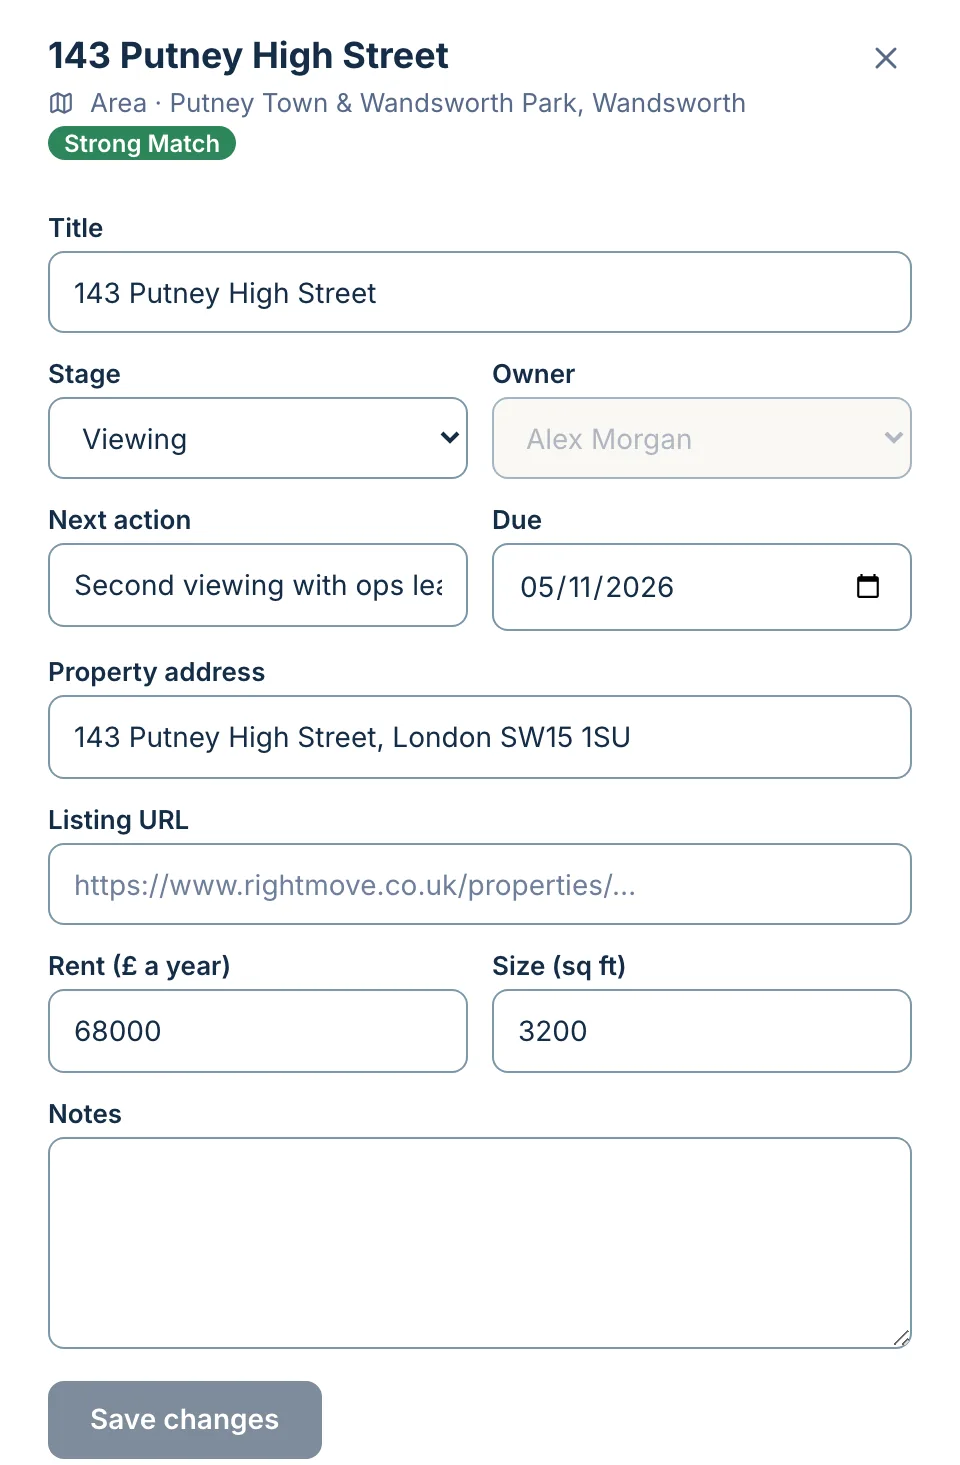
On a Scale plan, deals can be assigned to anyone on your team, and everyone sees the same board.
Check a unit before you view it
Before a viewing, most teams spend an hour or two on desk research: who's nearby, how people get there, whether there are any planning constraints, what the area is like after dark. Footprint now does that for you.
Paste the unit's address and run a check (on Pro and Scale plans). Footprint pulls together:
- Catchment. Residents within walking and driving distance, and how many match your target customer.
- Competition and neighbours. Competitors and complementary businesses within 400 and 800 metres.
- Transport. Nearest station and how busy it is.
- Planning constraints. Conservation areas, listed buildings and similar designations, each linked to its official source.
- Flood risk and crime. From Environment Agency and police data.
- Rent sense-check. How the asking rent per square foot compares with other units in your own pipeline.
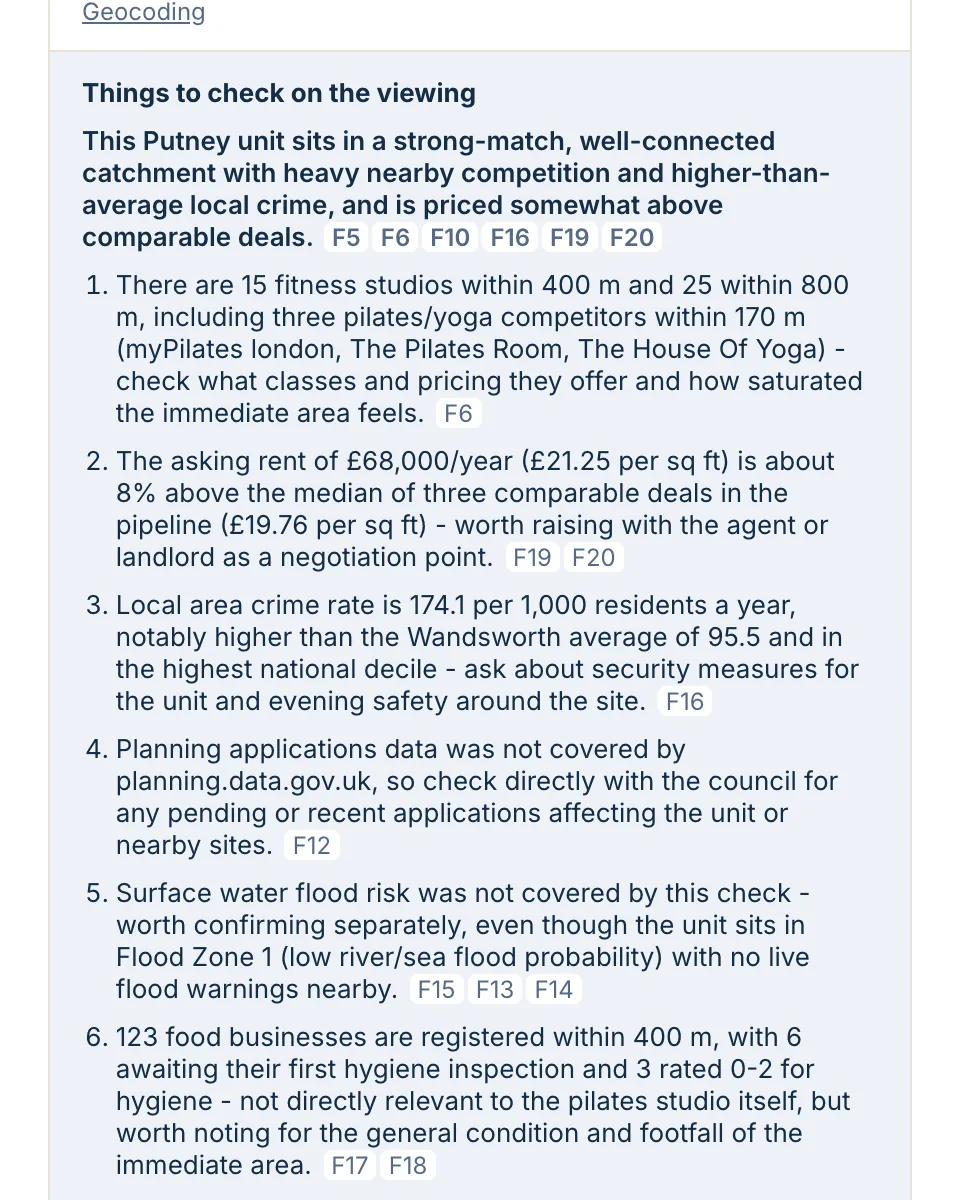
It finishes with a short list of things to check on the viewing, written only from the facts in the report. If a source has nothing for that address, the report says so rather than guessing.
Close the loop when a site opens
Most tools stop at the shortlist. Footprint keeps going.
When a deal reaches open, Footprint offers to add it to your existing sites. From then on it counts towards your estate when you search for the next location, plan territories or check how much two sites overlap.
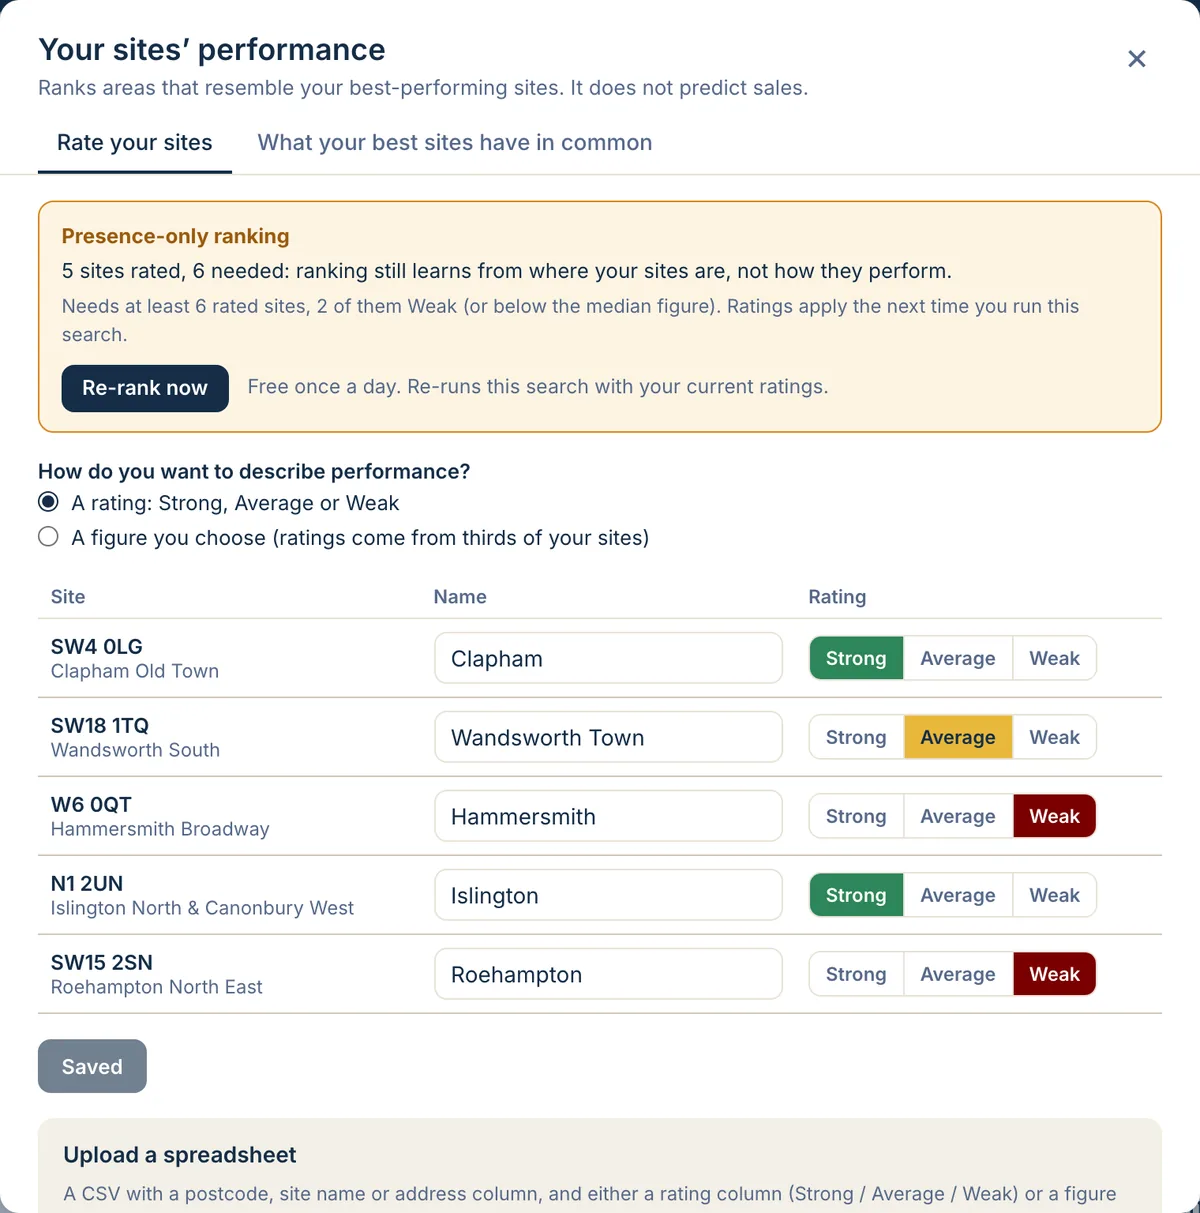
Once a site has been trading for a while, you can rate it Strong, Average or Weak, or enter a figure such as annual revenue. With enough sites rated, Footprint gives more weight to areas that look like your strongest locations. It won't predict sales, and we'd be wary of any tool that claims it can. But it does mean your next search starts from what you've learned, not from scratch.
Why it matters
Site acquisition is slow because the information is in too many places. Bringing the search, the deals and the checks together means fewer missed follow-ups, faster decisions and a clear record of why each site was chosen.
Deal tracking is included on every paid plan. If you'd like to see it with your own shortlist, try a search.